After my last post on analysing publication patterns I received quite a lot of feedback and many feature requests, so I decided to create an update once 2016 is over. It is now quite a bit bigger than before, and includes 11 different conferences and journals: ACL, EACL, NAACL, EMNLP, COLING, CL, TACL, CoNLL, *Sem+SemEval, NIPS, and ICML.
The information used in these graphs was collected through crawling the web. ACL Anthology was very useful, listing papers in a consistent format. However, information such as the organisation names in each paper still needed to be extracted directly from the pdfs, which means there are likely to be some errors. I’ve tried to create exceptions to catch different spelling variations and other anomalies, but if you notice mistakes in the graphs, do let me know.
This analysis shouldn’t be taken too seriously – after all, quality of research matters much more than quantity, and that is considerably more difficult to measure. However, my motivation is to provide a high-level overview of what is happening in the field, where the big players are publishing, and perhaps supply a bit of inspiration and motivation for the new year.
Let’s start by looking at publications from 2016 for the 25 most active organisations:
Carnegie Mellon managed to beat Google by just 1 paper. Microsoft and Stanford also managed to publish more than 80 papers in 2016. IBM, Cambridge, Washington and MIT all reached the 50 publication barrier. Google, Stanford, MIT and Princeton are distinctly focused on the ML aspect, publishing mostly in NIPS and ICML. In fact, Google papers counted for nearly 10% of all NIPS papers. IBM, Peking, Edinburgh and Darmstadt however are distinctly focused on the NLP applications.
Next, let’s look at individual authors:
Chris Dyer continued his impressive publication record, by managing 24 papers in 2016. I’m curious as to why Chris doesn’t publish in NIPS or ICML, but he did have a paper in every single NLP conference (barring EACL, which didn’t take place in 2016). Following him are Yue Zhang (18), Hinrich Schütze (15), Timothy Baldwin (14), and Trevor Cohn (14). Ting Liu from the Harbin Institute of Technology stands out with 10 papers in COLING. Anders Søgaard and Yang Liu both managed to have 6 papers in ACL.
Now let’s look at the most prolific first authors from 2016:
Three researchers managed to publish 6 first-author papers: Ellie Pavlick (University of Pennsylvania), Gustavo Paetzold (University of Sheffield), Zeyuan Allen-Zhu (Princeton University and Institute for Advanced Study). Alan Akbik (IBM) published 5 papers, and 7 more researchers had 4 publications.
In addition, there were 42 people with 3 first-author papers, and 231 with 2 first-author papers.
Let’s also look at some time series. First, the total number of papers published at different conferences:
NIPS has been a very big conference for several years, but this year it seems to have exploded. Also, COLING was bigger than expected this year, even beating out ACL. This was the first year since 2012 when NAACL and COLING coincided.
Next, the number of papers per organisation in each year:
CMU is leading the race, having overtaken Microsoft in 2015. However, Google has almost caught up as well, after accelerating at a breakneck speed. Stanford also has a very respectable track record, followed by IBM and Cambridge.
Finally, let’s look at individual authors:
Chris Dyer gets a very distinct upward line on this graph. Other researchers who have managed to keep increasing their output over the past 5 years are: Preslav Nakov, Alessandro Moschitti, Yoshua Bengio, and Anders Søgaard.
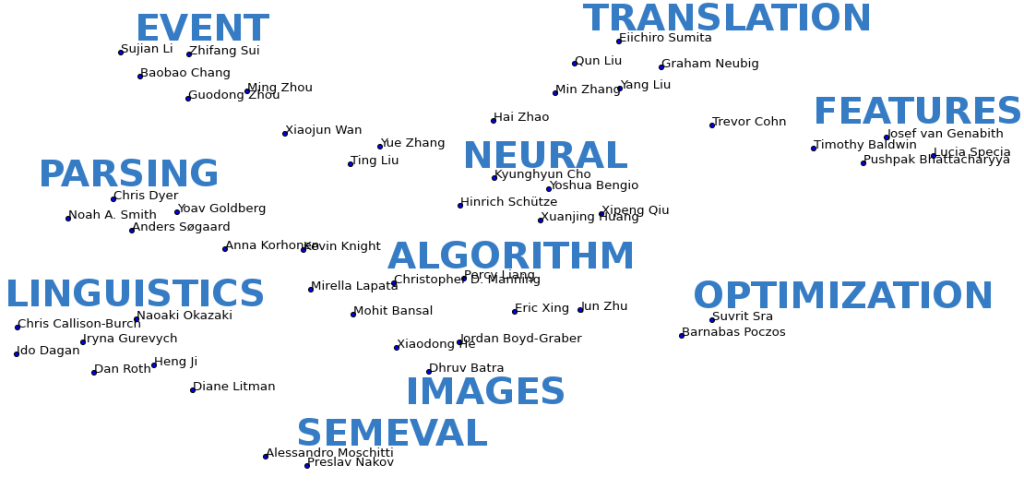
Finally, I also decided to do some topic modeling on the publications. First, I extracted all the plain text from the papers, tokenised and lowercased it, and removed stopwords. Next, I passed it through LDA in order to discover 10 latent topics. I then used t-SNE to visualise top authors and organisations in a 2-dimensional graph, based on their latent topic similarity. Finally, I manually labelled each of the clusters with one word from the highest-ranked terms found by LDA. Here is the visualisation for top 50 authors:
I created the same graph for organisations, but didn’t attempt to label them with single words, since major universities tend to publish in many different subfields. I leave it to you to interpret the clusters:
That’s all for now. If you have any corrections or suggestions, let me know.
Have a great 2017 and I hope to see you in this list next year!
Edit: Fixed a bug with the autor-year graph.
Edit: Fixed a bug with mapping different forms of university names


Cool analysis as always. *SEM seems to be *SEM+SemEval in practice, which you may not have intended. And I was slightly surprised not to see Melbourne in your final plot, but possibly a lack of papers in NIPS/ICML meant that we slipped out of contention (or it may have been caused by the “The University of Melbourne” vs. “Melbourne University” string mismatch?).
Thanks Tim!
*Sem indeed got combined with SemEval, since ACL Anthology also groups them together. I clarified this in the text.
I also looked into the possible string mismatch and indeed found that not all cases were being correctly attributed to Melbourne. I’ve fixed the bug and updated the graphs, Melbourne now gets included in the first graph.
I like these charts and analyses. If you find time, please write something similar for 2017. The community would benefit from such statistics. The only comment that I have is, we should be aware that these conferences/journals differ in terms of their acceptance rate. NIPS is way more competitive than *Sem or COLING, for instance. It would be good if we could, alongside analyses of this kind, also have an eye on each year’s acceptance rate for these conferences and publications. That would complement this information. At any rate, kudos. Please keep up the good work! 🙂